First steps into observability with OpenTelemetry, Honeycomb, and Kotlin
In this post we'll go through my initial journey to add observability to the Projektor test reporting app using OpenTelemetry and Honeycomb. Projektor already has traditional monitoring with metrics around p95 response times for each REST endpoint, counters for successful and failed operations, etc. But I was intrigued to see what additional production insights I could learn from some more advanced observability tools like Honeycomb.
Getting started
Projektor is written in a JVM language (Kotlin), so I started with Honeycomb's great guide on getting started with Java. Auto-instrumentation by the OpenTelemetry agent sounded like an easy way to initially extract observability data from the app, so I started wtih that approach. The framework Projektor uses - Ktor - is a bit niche so OpenTelemetry doesn't fully instrument it yet (full list of auto-instrumented frameworks). But Ktor uses Netty under the covers - which is supported by OpenTelemetry's auto-instrumentation, as well as the database queries with JDBC.
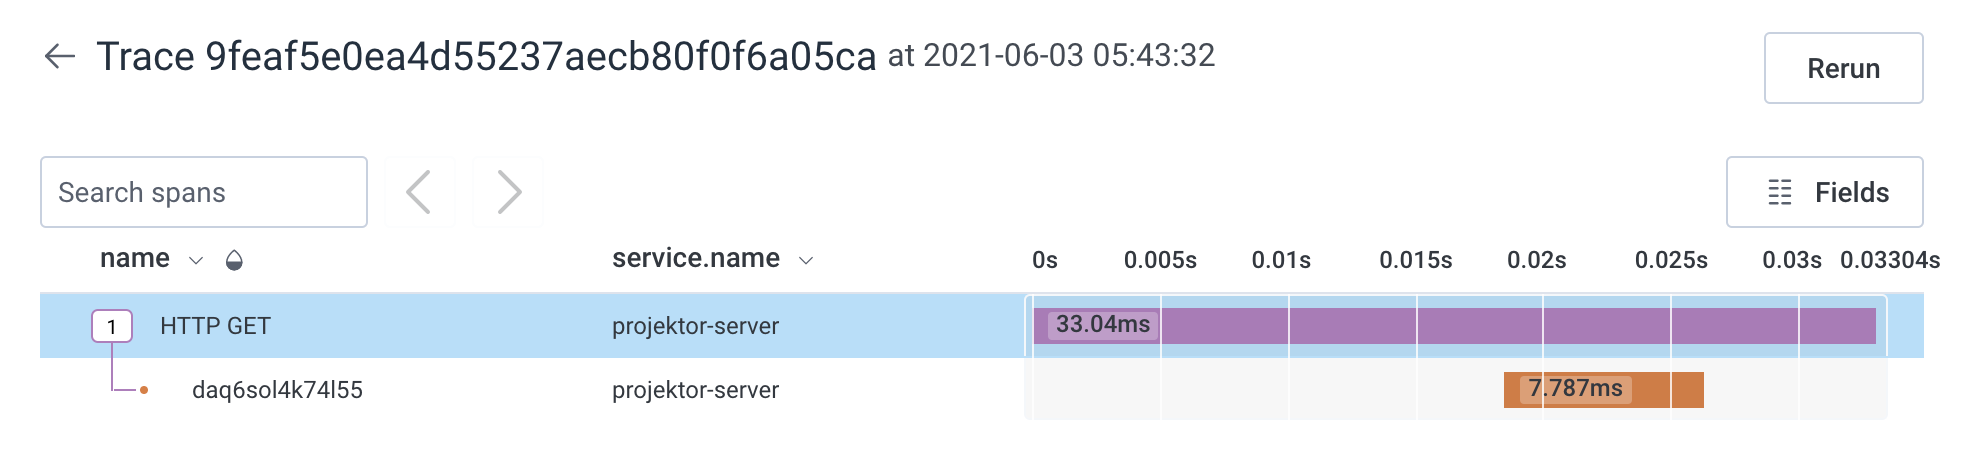
After running the app with the OpenTelemetry Java agent attached and the environment variables set for Honeycomb, I got my first set of traces in Honeycomb! Here's an example trace, including an overall span for the HTTP request and a child span for the database query:
Augmenting request attributes
One of the advantages of observability tools is they support wide events with many fields. Normally I use InfluxDB for storing metrics, and while InfluxDB has many advantages, one of the downsides is metric tags with many unique values result in high-cardinality datasets that can impact metric ingest performance. And that limits the amount of data available for querying or visualization in metrics. But spans support a much larger number of fields, so I explored what additional data might make sense to add.
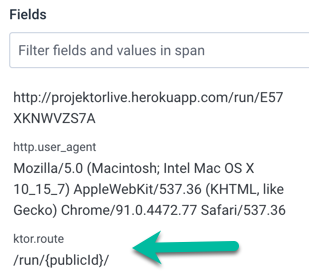
The existing span for the Netty request had the full URL, for example http://projektorlive.herokuapp.com/run/UDJVZQQCJMCV,
but its helpful to be able to query by server route/endpoint such as /run/{publicId}/ to find all requests to a given endpoint.
With OpenTelemetry, it's straightforward to add a new attribute to the current span.
So I added the Ktor route to the existing Netty request span by leveraging Ktor's ability to hook into each route before it is called
by subscribing to the Routing.RoutingCallStarted event.
Then the app can add the route as an attribute to the current span for each request:
 1import io.ktor.application.*
 2import io.ktor.routing.*
 3import io.ktor.util.*
 4import io.opentelemetry.api.trace.Span
 5
 6class OpenTelemetryRoute {
 7
 8    class Configuration {
 9        var includeHttpMethod: Boolean = false
10    }
11
12    companion object Feature : ApplicationFeature<Application, Configuration, OpenTelemetryRoute> {
13        override val key: AttributeKey<OpenTelemetryRoute> = AttributeKey("OpenTelemetryRoute")
14
15        override fun install(pipeline: Application, configure: Configuration.() -> Unit): OpenTelemetryRoute {
16            val configuration = Configuration().apply(configure)
17
18            pipeline.environment.monitor.subscribe(Routing.RoutingCallStarted) { call ->
19                val routeWithMethod = call.route.toString()
20
21                // By default, Ktor's route value includes the HTTP method such as "/run/{publicId}/(method: 'GET')"
22                // Conditionally remove the method part of the route so the attribute is "/run/{publicId}/" instead and easier to query by
23                val routeAttribute = if (configuration.includeHttpMethod) routeWithMethod else extractRouteWithoutMethod(routeWithMethod)
24
25                Span.current()?.setAttribute("ktor.route", routeAttribute)
26            }
27
28            return OpenTelemetryRoute()
29        }
30
31        private fun extractRouteWithoutMethod(routeWithMethod: String) = routeWithMethod.substring(0, routeWithMethod.indexOf("("))
32    }
33}
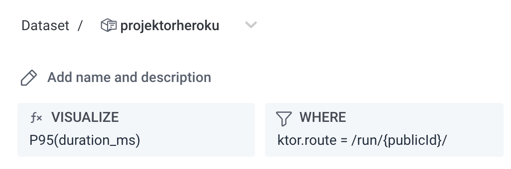
And now the route is available in the request span for querying:
and viewing in Honeycomb:
Adding custom spans
In addition to the auto-created span for the database query, I wanted to add spans
to track other key operations in the request.
Here I'll walk through adding spans to the repository class TestRunDatabaseRepository.
To start, I created a Tracer field in the class:
1import io.opentelemetry.api.GlobalOpenTelemetry
2import io.opentelemetry.api.trace.Tracer
3
4class TestRunDatabaseRepository(private val dslContext: DSLContext) : TestRunRepository {
5
6    private val tracer: Tracer =
7        GlobalOpenTelemetry.getTracer("projektor.TestRunDatabaseRepository")
8
Next I added two child spans - one to cover the entire repository function that fetches a test run and another to track the mapping portion of the function:
 1override suspend fun fetchTestRun(publicId: PublicId): TestRun? =
 2        withContext(Dispatchers.IO) {
 3            val span = tracer.spanBuilder("projektor.fetchTestRun")
 4                .setParent(Context.current().with(Span.current()))
 5                .startSpan()
 6
 7            val resultSet = dslContext
 8                .select(TEST_RUN.PUBLIC_ID.`as`("id"))
 9                .select(TEST_RUN.addPrefixToFields("summary"))
10                .select(TEST_SUITE.addPrefixToFields("test_suites_"))
11                .select(TEST_SUITE_GROUP.GROUP_LABEL.`as`("test_suites_group_label"))
12                .select(TEST_SUITE_GROUP.GROUP_NAME.`as`("test_suites_group_name"))
13                .from(TEST_RUN)
14                .leftOuterJoin(TEST_SUITE).on(TEST_SUITE.TEST_RUN_ID.eq(TEST_RUN.ID))
15                .leftOuterJoin(TEST_SUITE_GROUP).on(TEST_SUITE.TEST_SUITE_GROUP_ID.eq(TEST_SUITE_GROUP.ID))
16                .where(TEST_RUN.PUBLIC_ID.eq(publicId.id))
17                .orderBy(TEST_RUN.ID)
18                .fetchResultSet()
19
20            val mapperSpan = tracer.spanBuilder("projektor.fetchTestRun.mapper")
21                .setParent(Context.current().with(Span.current()))
22                .startSpan()
23
24            val testRun: TestRun? = resultSet.use {
25                testRunMapper.stream(resultSet).findFirst().orElse(null)
26            }
27
28            mapperSpan.end()
29
30            span.end()
31
32            testRun
33        }
A couple of notes:
- The OpenTelemetry library provides a
@WithSpanmethod annotation (docs) but as this method is a Kotlin coroutine it wasn't giving me accurate timing (the span completed in just microseconds). Instead, I manually created the spans withtracer.spanBuilder()and connected them to the existing parent span. - The code to add a child span connected to the parent span is a bit verbose, it'd be a good candidate to abstract away into a helper function.
And the resulting trace with the new custom spans added:
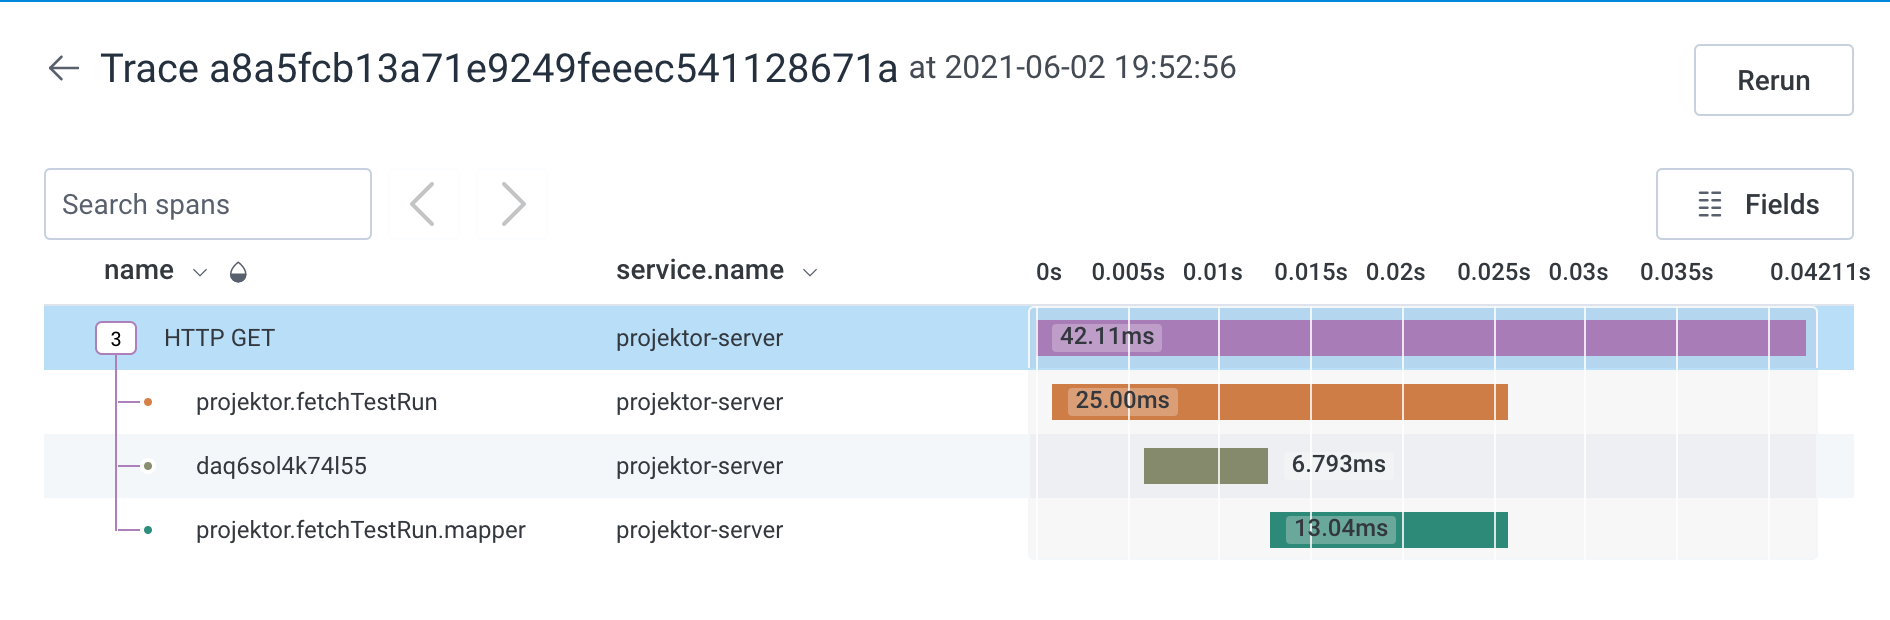
Adding the span around the mapping code already shows some insights - the mapping is taking longer than executing the database query. In this example, the Projektor app was running on a lower-tier Heroku worker with limited CPU/RAM so the mapper is resource constrained (the mapper only takes 1-2 milliseconds when running the app on my dev laptop).
Conclusion
Combining the auto-instrumentation of the OpenTelemetry agent with selected custom attributes and spans gives a thorough picture of the application's behavior in production, much more so than just metrics. I'm excited about the potential as I continue on this observability journey!