Craig Atkinson
Home
Blog
About
  • Customizing Recharts graphs for React and testing them with Cypress

    Mar 14, 2021 React Recharts testing Cypress

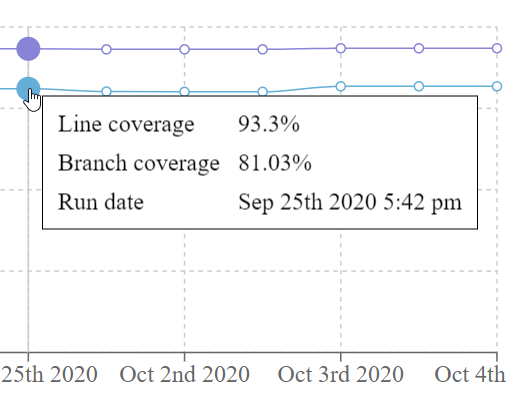
    After I added the ability to collect and store code coverage stats in the Projektor test reporting tool, I wanted to also add a graph that showed the trend of code coverage over time. Then users could track their repo's code coverage to see if was increasing, decreasing, or staying the same. The Projektor UI is built …

    Read More

Craig Atkinson

Software engineer, continually curious, highly caffeinated.
Read More

Featured Posts

  • Five ways to be a force multiplier in software engineering
  • Stop lighting money on fire: Seven tips to improve developer productivity
  • Lessons learned from building an open-source side project

Recent Posts

  • Five ways to be a force multiplier in software engineering
  • Stop lighting money on fire: Seven tips to improve developer productivity
  • Lessons learned from building an open-source side project
  • Why write code comments?
  • Cypress browser testing leveraging React Testing Library
  • Code coverage stats - are they helpful?
  • Testing OpenTelemetry JVM instrumentation with Kotlin
  • First steps into observability with OpenTelemetry, Honeycomb, and Kotlin

Categories

DEVELOPMENT 13 TESTING 5 OBSERVABILITY 3 CI 2 REACT 2 CAREER 1 OPEN-SOURCE 1

Tags

TESTING 6 KOTLIN 5 DEVELOPMENT 3 OBSERVABILITY 3 REACT 3 CYPRESS 2 DATABASE 2 GITHUB 2 OPENTELEMETRY 2 POSTGRES 2 CAREER 1 CI 1 CODE 1 CODE-COVERAGE 1
All Tags
CAREER1 CI1 CODE1 CODE-COVERAGE1 CYPRESS2 DATABASE2 DEVELOPMENT3 DOCKER1 GITHUB2 GITHUB-ACTIONS1 GRADLE1 HONEYCOMB1 INDEX1 JOOQ1 KOTLIN5 KTOR1 METRICS1 OBSERVABILITY3 OPEN-SOURCE1 OPENTELEMETRY2 PERFORMANCE1 POSTGRES2 PRODUCTIVITY1 REACT3 RECHARTS1 SIDE-PROJECT1 TESTING6
[A~Z][0~9]

Copyright © 2022 CRAIG ATKINSON. All Rights Reserved